Core Math Worksheets
Fraction Worksheets
Word Problems
Algebra and Trigonometry
Other Worksheets
Place Value
Percentages
Rounding Numbers
Ordering Numbers
Standard, Expanded, Word Form
Mean Median Mode Range
Ratio Worksheets
Probability Worksheets
Roman Numerals
Factorization, GCD, LCM
Prime and Composite Numbers
Pre-Algebra
Geometry Worksheets
Blank Clocks
Telling Analog Time
Analog Elapsed Time
Greater Than and Less Than
Money
Arithmetic Sequences
Geometric Sequences
Venn Diagram
Graph Worksheets
Measurement & Conversions
Patterns and Puzzles
Color by Number
Holiday & Seasonal
Early Learning
Printables
Calculators
Black and White Multiplication Charts
Black and White Multiplication Charts
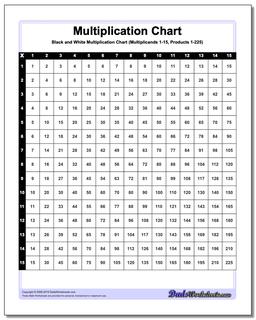
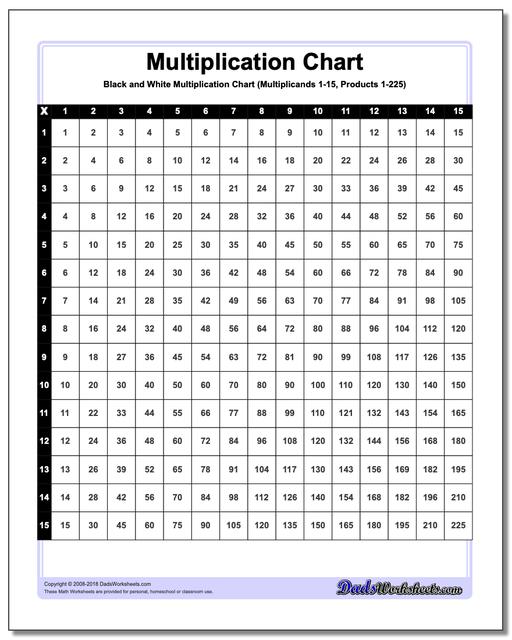
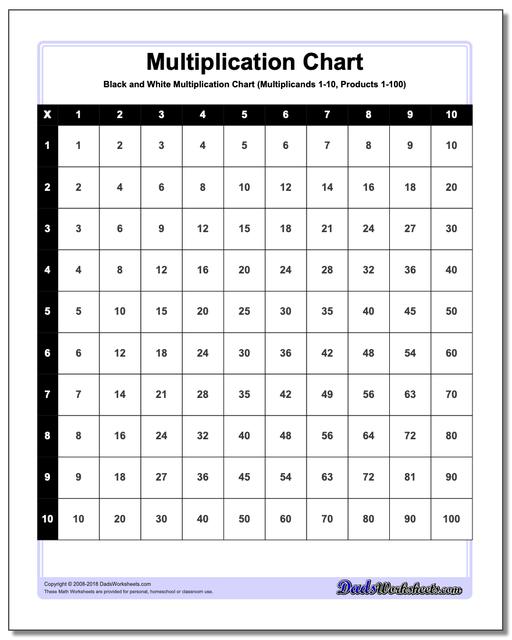
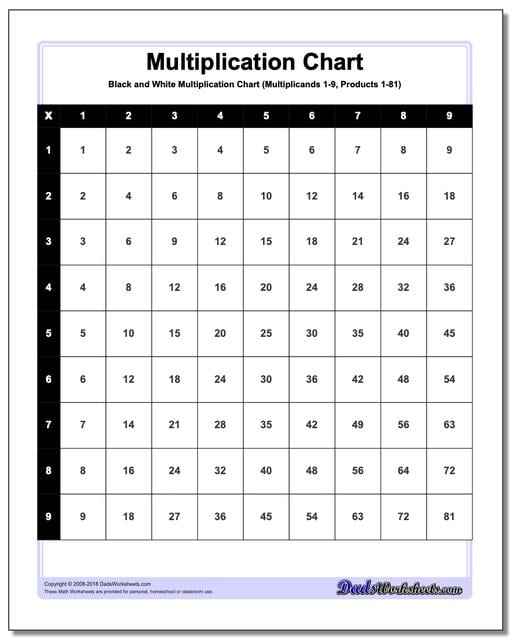
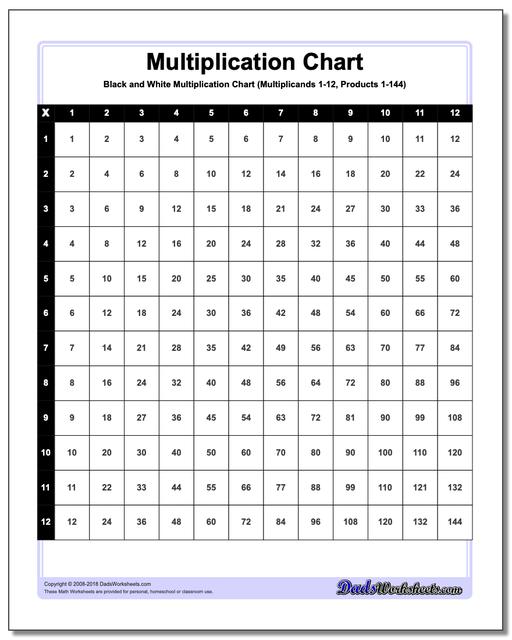
This version of the chart presents the multiplication table in a basic black and white grid. These charts are often used for its simplicity and clarity because it is easier to read and understand the multiplication relationships between numbers.
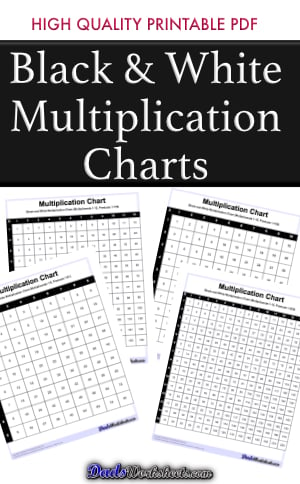
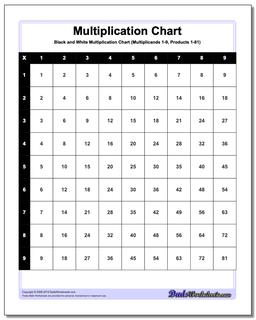
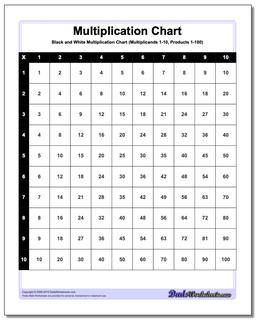
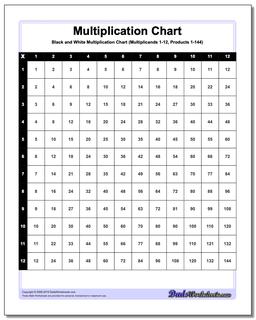
There are different variations of high-resolution black and white multiplication chart on this page with facts from 1-9 (products 1-81), 1-10 (products 1-100), 1-12 (products 1-144), and 1-15 (products 1-255). If you are looking for colored or themed charts, be sure to check out the main multiplication chart page for dozens of of other styles and variations!
High-Resolution Black and White Multiplication Charts
Printable Times Table Chart in Classic Black and White
Having a printed multiplication chart on hand can make the difference between bumbling through a multiplication problem or memorizing the facts and becoming a multiplication rock star. The classic printable multiplication charts on this page are your basic go-to resource for cementing the multiplication facts into long term memory, and the black and white variants can be used for activities like coloring cells to find patterns or highlighting specific facts students might be struggling with. If you are looking for more variety, be sure to check out some of the dozens of other versions at the main multiplication chart page!
Worksheet History
These are not the Multiplication Charts you are looking for?
Click to check out the main multiplication chart page... You'll find dozens of other options including cool color multiplication charts, multiplication charts with different ranges of products and much more...
Activity for Black and White Multiplication Charts
Yes, since the main goal of multiplication charts is to aid in learning, they should be simple, but coloring a black and white multiplication chart can also benefit kids who are just starting to learn the multiplication table. It can be an enjoyable and instructive exercise for them too! They will enjoy a creative task and be able to interact with topics related to multiplication. Here's a quick how-to for organizing and leading this coloring activity:
Materials Needed:
- Printouts of Black and white multiplication chart
- Any of these: crayons, colored pencils, markers, highlighters or colored pens
Steps:
- Print out copies of the black and white multiplication chart. Make sure that the charts are printed nicely and readable.
- Tell your little ones at the beginning of the activity that they will be coloring the multiplication chart to make it more aesthetically pleasing and understandable.
- Depending on the kids' ages and abilities, talk about various coloring techniques. Younger kids might concentrate on using their preferred colors to color in particular rows or columns. Older kids can draw attention to patterns, including multiples of a given number or the diagonal of squares (1x1, 2x2, 3x3), by using different colors.
- Monitor and assist as needed. Guide them on color choices and check if they understand the multiplication relationships.
- Let the kids explore the multiplication chart as they color. Ask questions like:
- What patterns do you see?
- Can you find any interesting numbers or facts in the chart?
- How does coloring the chart help you understand it more?
- Hang the colored multiplication charts in the classroom wall or at home as visual aids for learning.
- Remind the children to refer to their charts when practicing multiplication or solving math problems.
Other Multiplication Chart Activities
Fill in the Blanks
Once your little ones have memorized the times table, you may now test how well they know the multiplication facts by asking them to fill in the missing parts of a chart. This is an effective way to finally know by heart the multiplication tables. Print out a Fill-in multiplication grid problem worksheet. These are partially completed multiplication charts that needs to filled in and completed, either by fact recall, repeated addition, skip counting, or any other memorization technique that is effective for each student. Answer keys to these type of activity also make a great multiplication chart.
Speed Tests
After having the students practice and perfected the “Fill in the blanks” activity, the next step to enhance their multiplication fact fluency is to time it. This is where you can practice your tables against the clock. Let them fill in the partially completed chart within a set time limit.
Create Patterns
Challenge students to find and create interesting patterns within the multiplication chart. For example, ask them to circle all prime numbers or put a heart on all even products.
Math Relay Races
Divide students into teams and set up relay races where each team member must find a specific product on the multiplication chart. You will be the one to give out the multiplication problem. The team member must encircle the right answer on the chart then pass the baton to the next team member. You may ask them simple questions on the initial rounds of the game (e.g. 7x8, the team member must encircle 56 on their chart and so on..)The first team to finish wins. If you want to challenge them more, give out multiplication word problems on the next round of the game.
Parts of a Multiplication Chart
A multiplication chart is a table that shows the products of two numbers. Usually, one set of numbers is written on the left-most column and another set is written at the top row. For multiplication charts with bigger multiplication facts, 50x50 or 100x100 for instance, these sets are sometimes written on the right-most column and bottom part of the chart to help the user find the products of two numbers easily. The products make up the rest of the table/chart. Multiplication charts typically consist of several key parts that organize and present multiplication facts in a structured manner. Let me walk you through the parts. Continue reading below…
Header: This is the part of the multiplication chart that is usually illustrated in bolder or bigger texts. You will see the header at the top row and left most column of the chart. These are the mutipliers (column) and multiplicands (row) with the numbers 1 through 12, 1 through 15, (or sometimes up to 10 in simpler charts).
Grid Structure: The main body of the multiplication chart is a grid where rows and columns intersect to display multiplication results. For example, if the chart goes from 1 to 10 for both multiplicands and multipliers, the grid will be a 10x10 matrix. If the chart goes from 1 to 30 for both multiplicands and multipliers, the grid will be a 30x30 matrix.
Multiplication Results: Within the grid, each cell represents the product of the corresponding row (multiplicand) and column (multiplier). For instance, you are trying to solve 4x5. You will find the product where the cells in row 4 and column 5 intersect, which is of 4×5=20. The cell where row 7 and column 9 intersect will contain the product of 7×9, which is 63.
Perfect Squares: This is the diagonal line running from the top left to the bottom right. These cells contain squared numbers (e.g., 1x1, 2x2, 3x3). These are usually shaded or in different color to highlight the perfect squares on the multiplication chart.
