Core Math Worksheets
Fraction Worksheets
Word Problems
Algebra and Trigonometry
Other Worksheets
Place Value
Percentages
Rounding Numbers
Ordering Numbers
Standard, Expanded, Word Form
Mean Median Mode Range
Ratio Worksheets
Probability Worksheets
Roman Numerals
Factorization, GCD, LCM
Prime and Composite Numbers
Pre-Algebra
Geometry Worksheets
Blank Clocks
Telling Analog Time
Analog Elapsed Time
Greater Than and Less Than
Money
Arithmetic Sequences
Geometric Sequences
Venn Diagram
Graph Worksheets
Measurement & Conversions
Patterns and Puzzles
Color by Number
Holiday & Seasonal
Early Learning
Printables
Calculators
Multiplication Chart: Grid Multiplication Chart
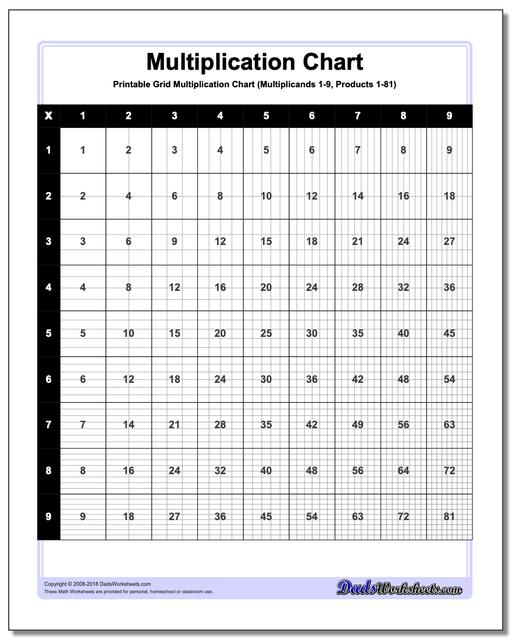
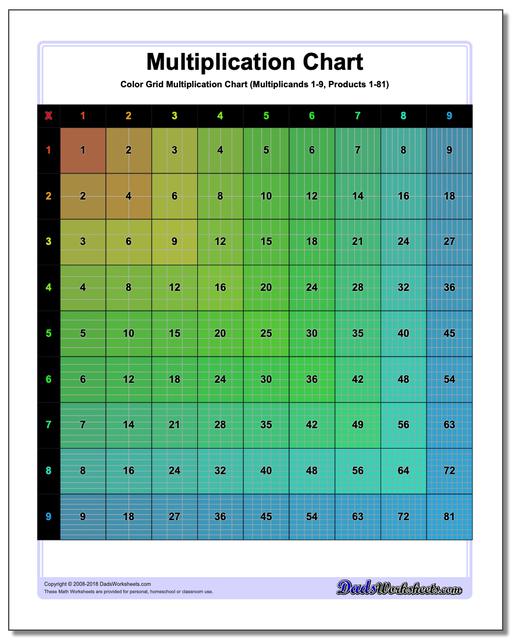
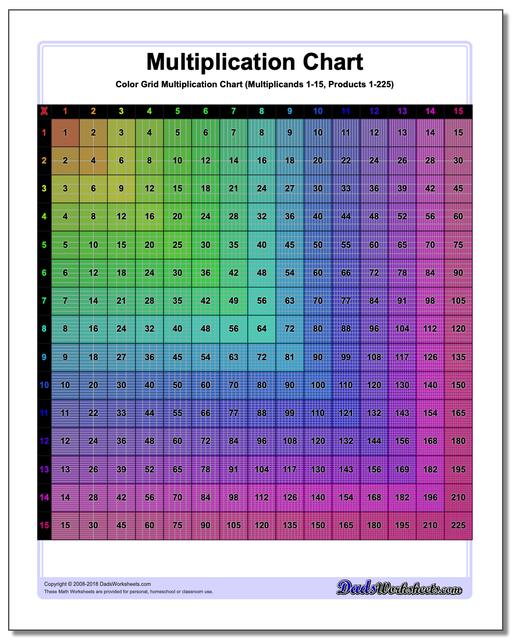
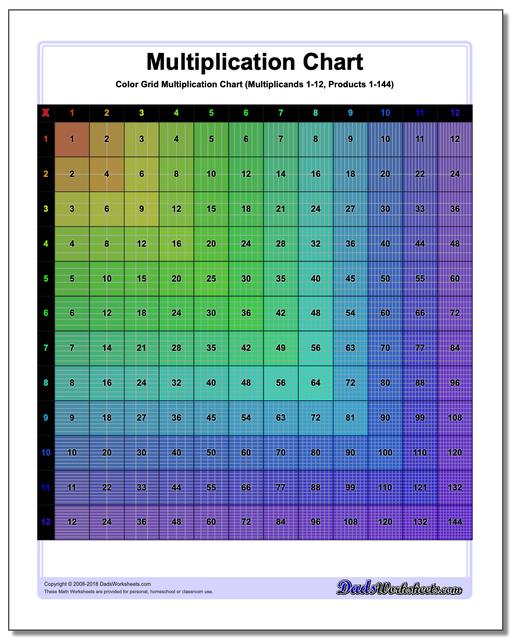
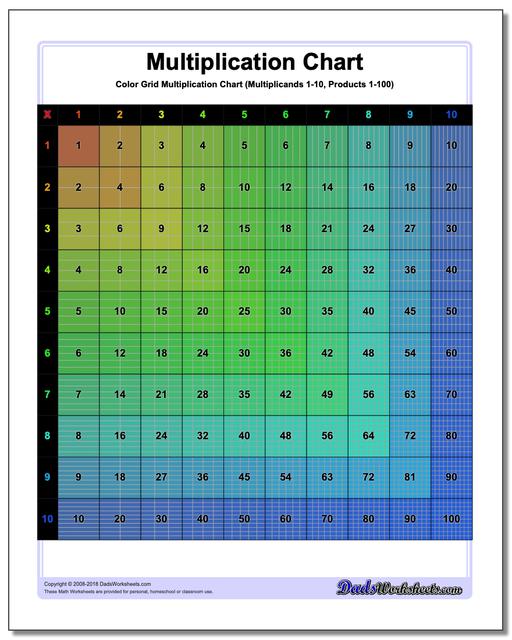
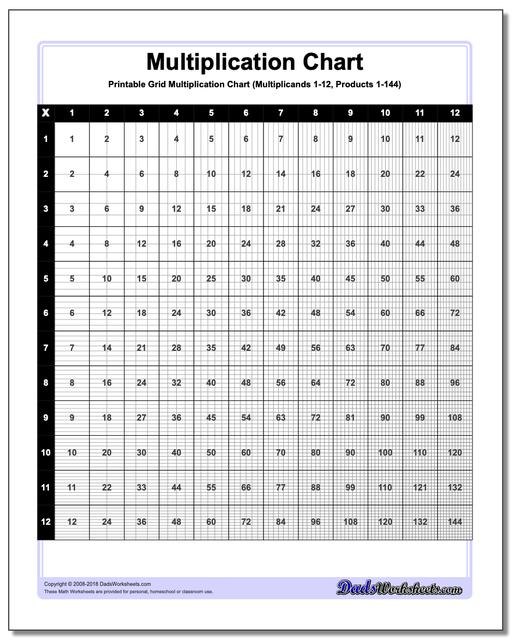
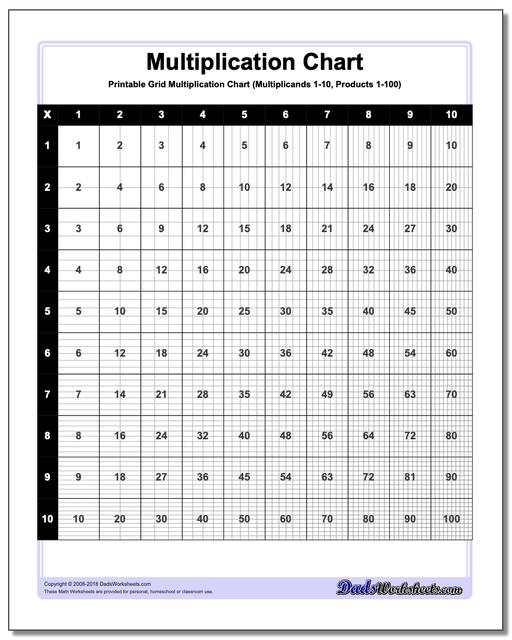
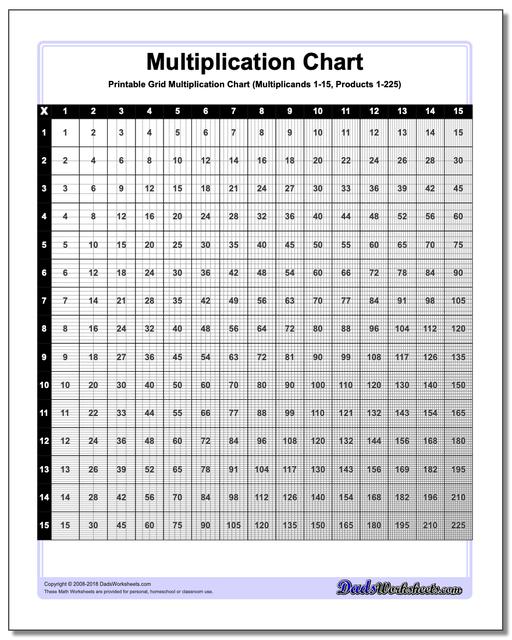
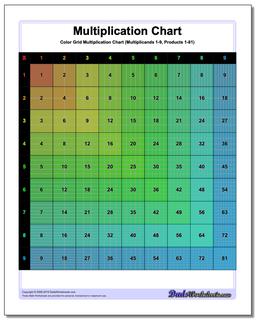
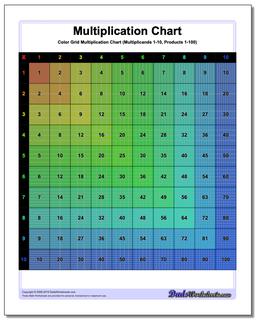
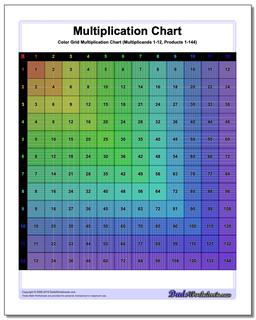
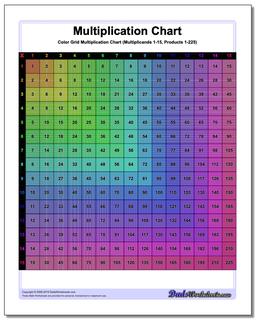
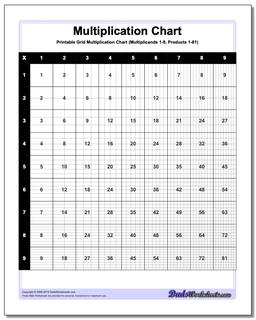
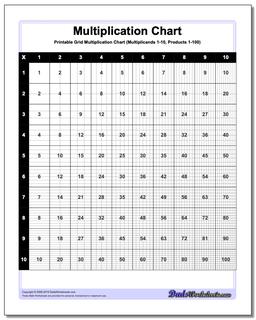
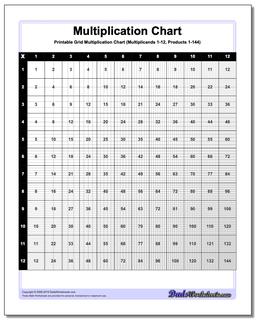
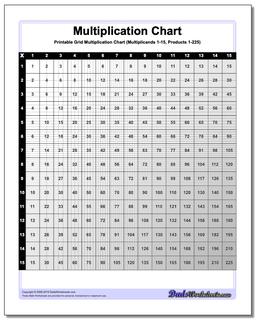
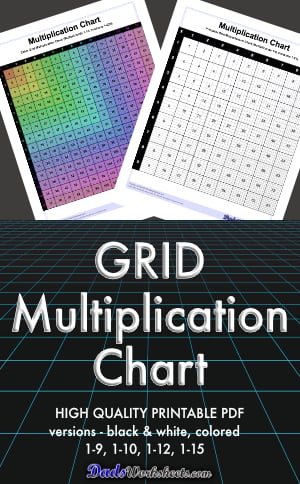
This printable chart presents the multiplication table with cells divided to reflect the actual product. Separate black and white and color versions of the multiplication chart, each with ranges 1-9, 1-10, 1-12 and 1-15.
Colored Grid Multiplication Chart
Grid Multiplication Chart
This page has printable charts that present the multiplication table with cells divided to reflect the actual product. There are two sets available - black and white and the coloured version of the multiplication chart, each with ranges 1-9, 1-10, 1-12 and 1-15.
Printable Grid Multiplication Chart
Grid multiplication charts, also known as multiplication grids or arrays, are practical, hands-on tools used to teach and understand multiplication. It can be helpful to visualize multiplication products when learning the times table, and these printable grid multiplication charts are great especially for visual learners since each cell represents the product of the corresponding row and column headers in tiny squares in it and the numeric form displayed on the cell. Each version of the chart divides the products into cells, so the multiplication chart up to 100 will have in its final cell 100 tiny squares. These kind of charts provide a structured way to view and calculate the products of numbers.
Understanding The Multiplication Chart
Reading a multiplication chart is as simple as spotting your desired numbers and identifying where they intersect. The chart consists of rows and columns, each labeled with numbers. The first column and row serve as headers. All the numbers aside from the headers are the products that usually start from 1 and go up to a specific limit. In a grid multiplication chart, each cell or box in the grid represents the product of the headers (number at the top of its column and the number at the beginning of its row).
Assuming you have printed a grid multiplication chart 1-9. You will see that the header numbers that represent the multiplicands are 1-9, and the products start from 1 and end at 81. The first cell contaning the product 1 has 1 whole box, and the last cell containing the product 81 has 81 tiny boxes in it.
Let’s try one example. To find the product of 2 and 6, locate 2 on the left column and 6 at the top row. Find their intersection, and you see the number 12, which is their product. This cell also contains 12 tiny boxes using a grid multiplication chart. Take note also that when you apply the commutative property of multiplication, you will get the same product (12) if you do it the other way around (locate 6 on the left column and 2 at the top row). The commutative property states that changing the order of multiplication does not change the product. 2x6=12 and 6x2=12.
Multiplication Chart and Other Math Concepts
Grid multiplication charts can be integrated with other math concepts too. By doing so, it will provide students with a cohesive understanding of mathematics because the visual nature of the grid supports concrete learning experiences that will assist students connect mathematical operations and relationships across different domains of mathematics. Here are some of the math concepts and a brief description for each on how they can be integrated with the grid multiplication chart…
Division: Grid multiplication charts can help students understand the relationship between multiplication and division. For example, by using the same grid, students can see how division is the inverse operation of multiplication. For example, 7 x 5 is 35, which I can locate on my multiplication chart fairly easily, but 35 divided by 5 has only one answer, 7. All I have to do is find 35 on the chart, locate 5 to the left, and I’ll find 7 above. Students can find division facts related to multiplication facts by looking at rows and columns interchangeably.
Fractions: Grid multiplication charts are useful for visualizing and understanding the multiplication of fractions. This visual representation aids in understanding concepts like multiplying numerators and denominators separately. Students can locate fractions on the grid and explore how to multiply fractions by whole numbers or other fractions. Furthermore, if you observe the chart carfefully, you will see that you can do so many things that involve fractions: finding the equivalents; how to simplify fractions; how to compare fractions; how to add and subtract fractions; and so on… If you need a quick reference for understading equivalent fractions, here’s a nice fraction chart that will help you get started on this math concept.
Ratios and Proportions: Grid multiplication charts can be used to illustrate ratios and proportions as well. For example, if one cell in the grid represents a part of a whole, students can use the grid to explore proportional relationships by comparing different parts of the grid.
Area and Perimeter: Using grid multiplication charts, students can understand the concept of area as rows and columns multiplied together. They can calculate the area of rectangles and irregular shapes by counting grid squares. Similarly, perimeter can be understood by adding up the sides of the shapes represented on the grid.
Probability and Statistics: Grid multiplication charts can be used in probability and statistics to visualize and calculate probabilities. For instance, by considering the total number of cells in a grid and the number of favorable outcomes, students can calculate probabilities of events occurring.
Algebraic Concepts: Grid multiplication charts can support the introduction of algebraic concepts such as variables and expressions. Students can use the grid to understand how variables can represent unknown quantities and how algebraic expressions can be simplified or expanded.
Geometry: In geometry, grid multiplication charts can help students understand geometric transformations and symmetries. They can explore how shapes change when multiplied by scaling factors, and how symmetry properties are preserved or altered.
Worksheet History
