Core Math Worksheets
Fraction Worksheets
Word Problems
Algebra and Trigonometry
Other Worksheets
Place Value
Percentages
Rounding Numbers
Ordering Numbers
Standard, Expanded, Word Form
Mean Median Mode Range
Ratio Worksheets
Probability Worksheets
Roman Numerals
Factorization, GCD, LCM
Prime and Composite Numbers
Pre-Algebra
Geometry Worksheets
Blank Clocks
Telling Analog Time
Analog Elapsed Time
Greater Than and Less Than
Money
Arithmetic Sequences
Geometric Sequences
Venn Diagram
Graph Worksheets
Measurement & Conversions
Patterns and Puzzles
Color by Number
Holiday & Seasonal
Early Learning
Printables
Calculators
Multiplication Chart: Proportioned Multiplication Chart
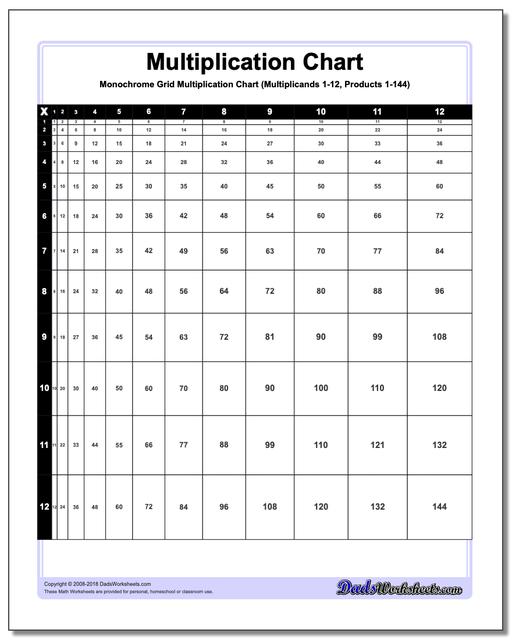
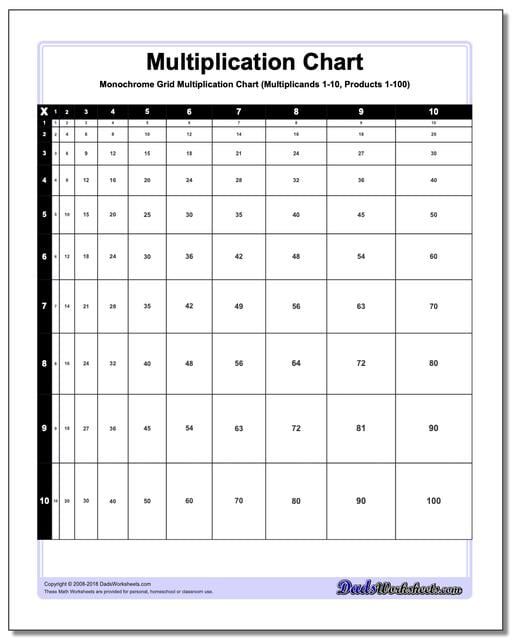
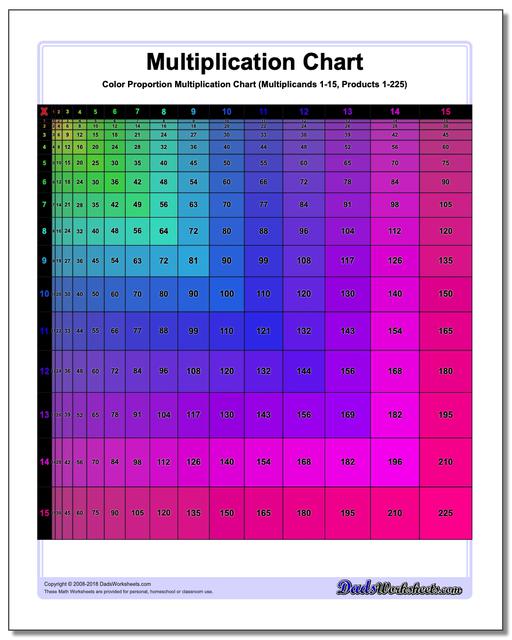
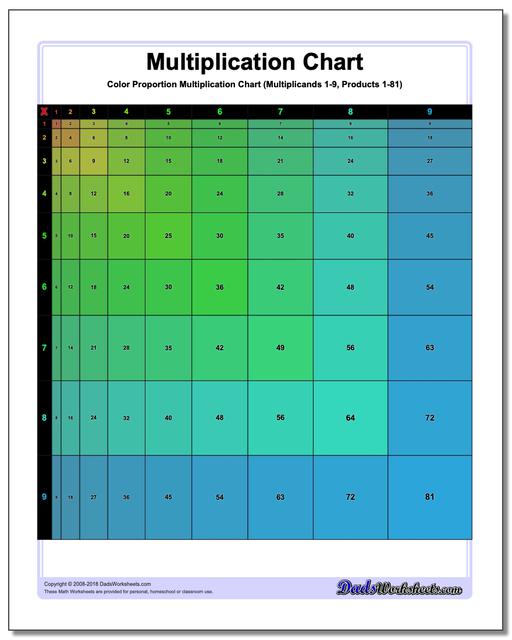
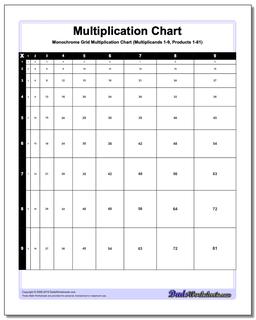
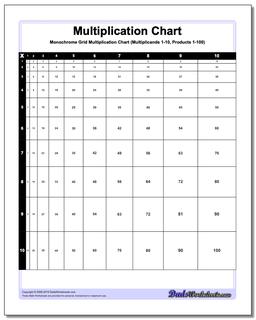
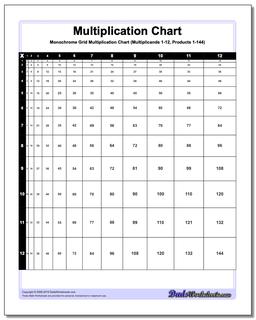
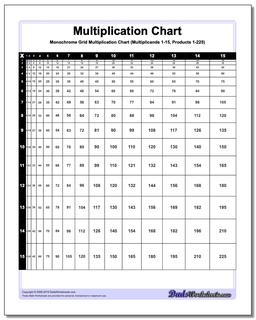
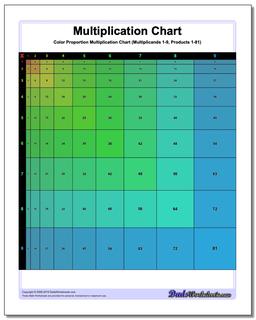
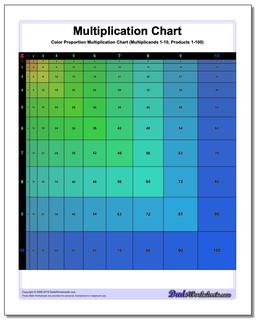
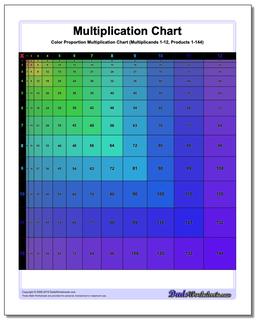
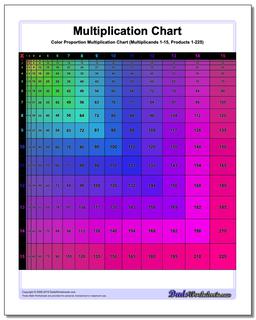
This printable multiplication chart presents the products where their sizes are relative to the answer. This is a great way to see the size and scale of each product relative to the others in the chart. Each multiplication chart has black and white and colored versions.
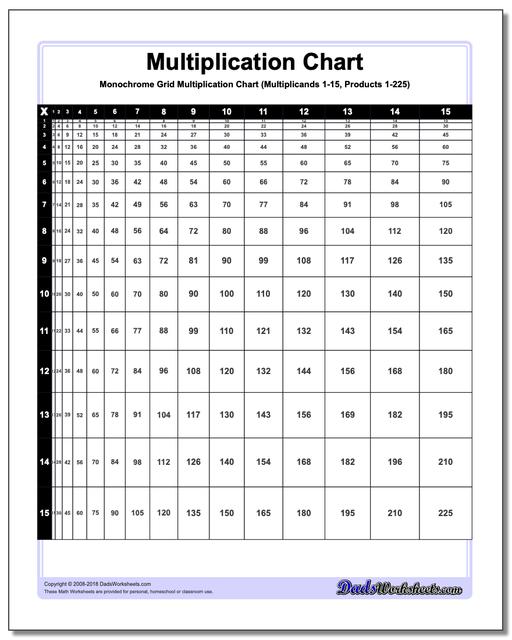
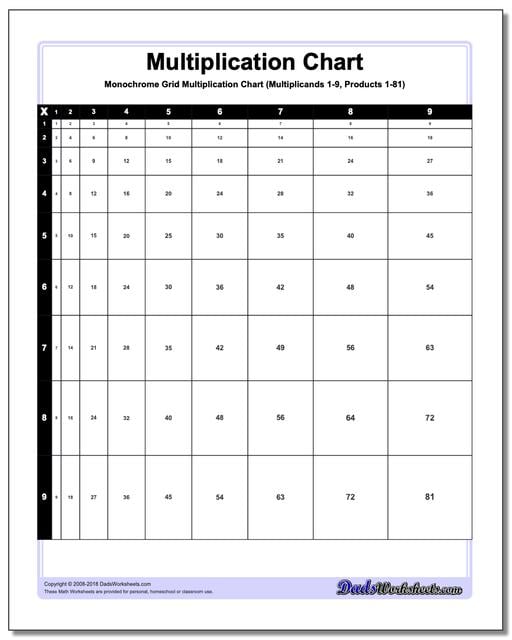
Proportioned Multiplication Chart (Black and White)
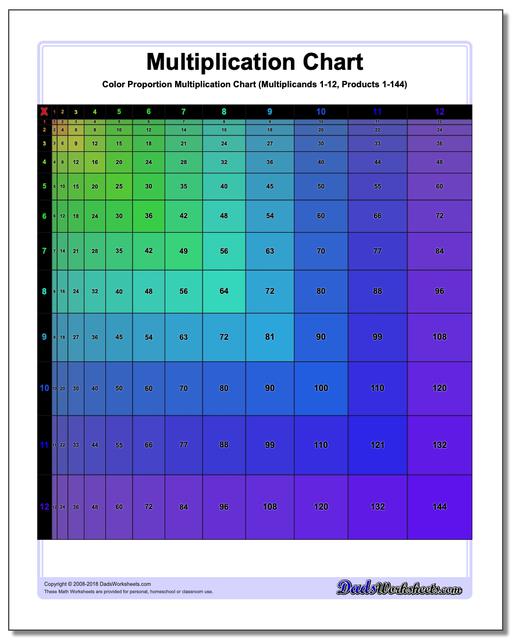
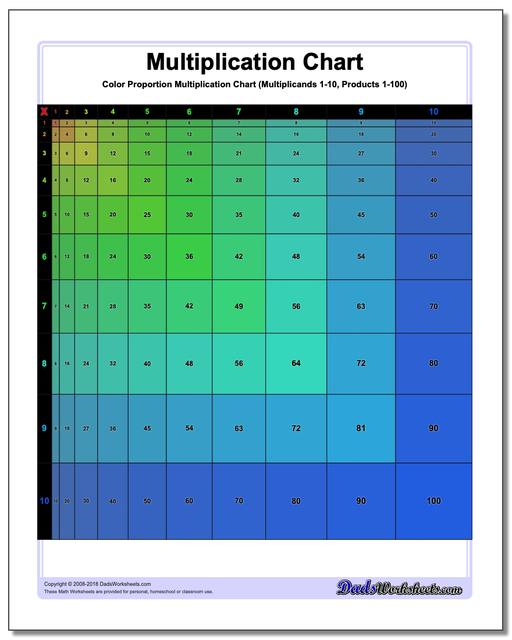
Proportioned Multiplication Chart (Color Version)
Proportioned Multiplication Chart
The printable multiplication charts on this page presents the products where their sizes are relative to the answer. This is a great way to see the size and scale of each product relative to the other numbers in the chart.
There are four variations of multiplication chart for both black and white and colored versions that ranges from 1-9, 1-10, 1-12, and 1-15. All charts print in high resolution PDF format especially the colored the 1-12 and 1-15 versions of the chart! If you are ready, click through and print any of the proportioned multiplication charts on this page. Or if you want to know more interesting facts about this type of chart, continue reading below…
Printable Proportioned Multiplication Chart
Here is another interesting way to visualize the times table. If you have seen the Grid multiplication chart from our main multiplication chart page (the one where the products are in boxes with tiny squares in it and the numeric form displayed on the cell), the proportioned multiplication chart introduces the products differently. This time the products are presented on scales and show what multiplication does in one look.
What does it mean when I say on scales? Every one of the cells in this printable chart is sized proportionately to the product for that multiplication fact. Say for multiplication chart 1-10, with multiplicands and multipliers of 1-10 and products starting from 1 and ending in 100, the product 1 being the smallest in the chart has the smallest box and the product 100 has the biggest box. This is because each cell in the chart represents the result of multiplying the corresponding row number (multiplicand) by the corresponding column number (multiplier). As both the row number and the column number increase from 1 to 10, the product of their multiplication also increases. Hence, the values increase diagonally from the top left corner to the bottom right corner of the chart. In a proportioned multiplication chart, the size of the box is relative to the answer or the product. As the value of the product increases, so does the size of the box. This pattern is especially useful for visual learners in understanding how multiplication works and a very helpful tool to memorizing the multiplication facts since the arrangement reflects the scaling factor accurately to visually depict how numbers grow relative to each other. By observing these scaling relationships, students will have a deeper understanding of how multiplication operates beyond simple linear progression.
Traditional Versus Scaled Multiplication Grid Visual
The main difference between traditional and scaled multiplication charts lies primarily in how the information is presented and how they are used to understand multiplication concepts.
A traditional multiplication chart is typically a grid or table that lists all products of numbers based on its headers (multipliers and multiplicands). It is organized in rows and columns where each cell represents the product of the corresponding row and column numbers. It has a symmetrical layout with constant and uniform spacing. The numbers are evenly spaced and follow a consistent sequential order, offering a simple reference for learning multiplication facts by heart. Given the format and layout of these type of multiplication tables, you will notice that they are primarily focused on the concept of memorizing the multiplication facts. On the other hand, scaled charts let students take a grasp of multiplication as a concept rather than just a series of memorized equations. Here’s why…
A proportioned multiplication chart, also called scaled multiplication chart, is basically a regular chart that uses a non-linear scale to represent multiplication relationships visually. The rows and columns are organized like a traditional chart but the scaling factor makes it a little different. As I mentioned above, the scales grow as the product increases because the size of the box is relative to the answer or the product. This feature helps students see the multiplication patterns and relationships more dynamically in a scaled chart than in a traditional one. These scaled multiplication charts promote deeper learning primarily because they offer a nuanced representation of multiplication patterns.
While the classic types or the traditional multiplication charts are widely used for learning multiplication facts, proportioned multiplication charts offer a deeper understanding of multiplication patterns and relationships through a non-linear visual representation. They serve different purposes in the educational context, with traditional charts supporting basic arithmetic fluency and scaled charts fostering conceptual understanding and mathematical exploration. Students are motivated to ask questions about why certain patterns emerge, how scaling affects multiplication outcomes, and how these concepts connect to broader mathematical principles. This inquiry-based approach encourages active engagement, leading to a more profound understanding of mathematical concepts such as prime numbers, fraction, ratio & proportion, extending across arithmetic, algebra, number theory, and even geometry.
To wrap things up, the traditional ones (e.g. a basic black and white multiplication chart) would be a pefect tool if you are just starting to learn the multiplication facts to help you with memorization. And then moving forward, proceed by exploring the proportioned multiplication charts and see how they relate to other math concepts.
More Printable Multiplication Charts
If you’re just looking for the scaled times table, then go ahead and print any of the proportioned multiplication charts above. If you want to see more of the other available chart variations we have created, be sure to check out the main multiplication chart page... You'll find lots of other options including grid multiplication charts, themed multiplication charts, blank multiplication charts with different ranges of products and much more...
