Core Math Worksheets
Fraction Worksheets
Word Problems
Algebra and Trigonometry
Other Worksheets
Place Value
Percentages
Rounding Numbers
Ordering Numbers
Standard, Expanded, Word Form
Mean Median Mode Range
Ratio Worksheets
Probability Worksheets
Roman Numerals
Factorization, GCD, LCM
Prime and Composite Numbers
Pre-Algebra
Geometry Worksheets
Blank Clocks
Telling Analog Time
Analog Elapsed Time
Greater Than and Less Than
Money
Arithmetic Sequences
Geometric Sequences
Venn Diagram
Graph Worksheets
Measurement & Conversions
Patterns and Puzzles
Color by Number
Holiday & Seasonal
Early Learning
Printables
Calculators
Multiplication Chart: Shaded Multiplication Chart
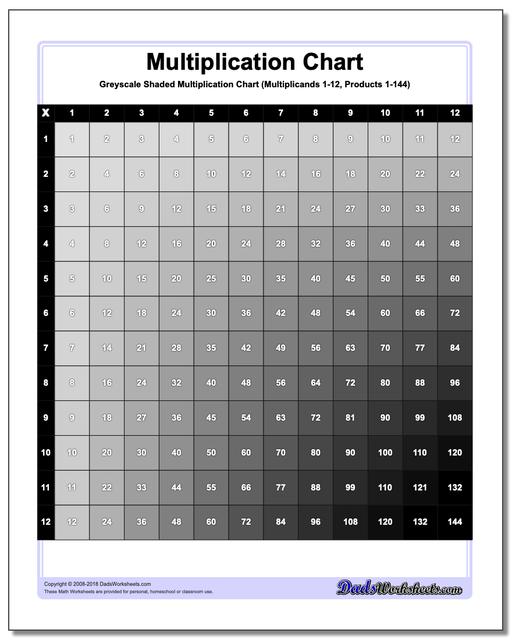
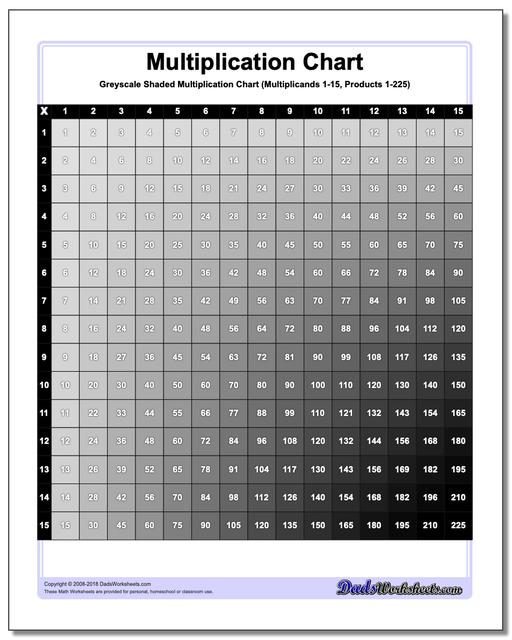
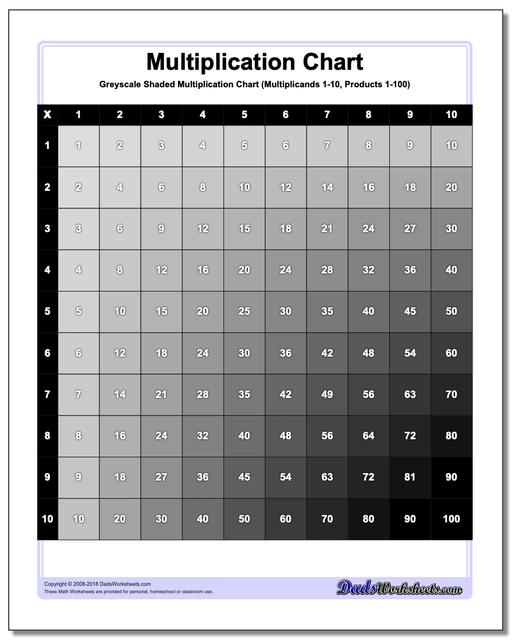
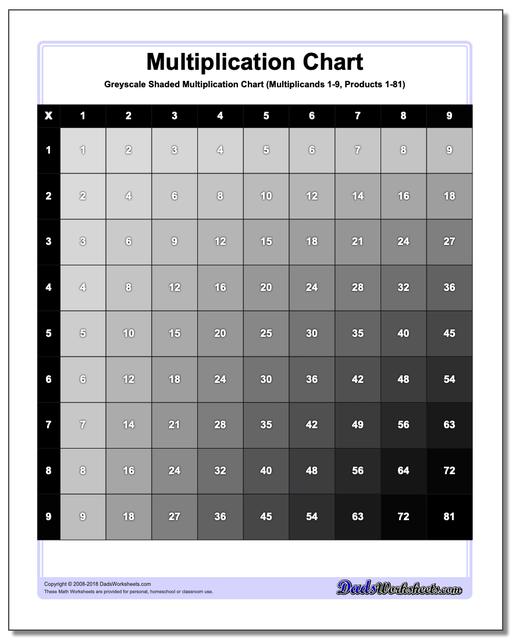
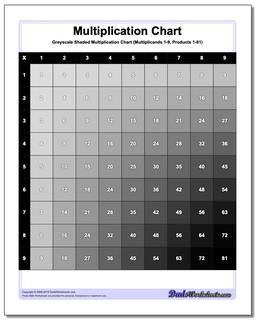
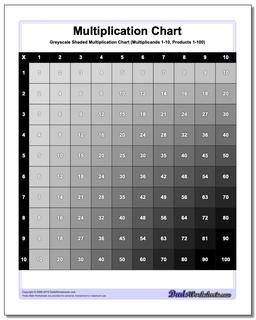
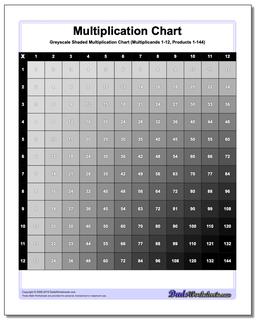
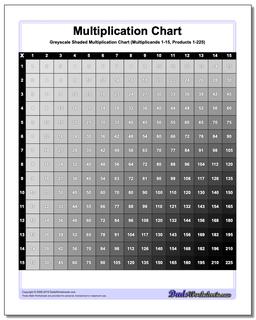
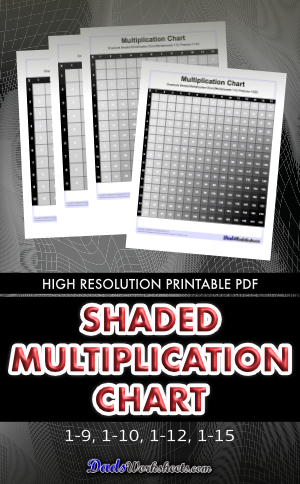
These multiplication charts present the multiplication table with each multiplication fact shaded to reflect the product. Larger multiplication products are shaded darker on the chart.
Shaded Multiplication Chart
Shaded Multiplication Chart
If colors aren't your thing, or maybe you just have a black and white printer, then these shaded multiplication charts are just for you. The variants with products to 81, to 100, to 144 and to 225 provide plenty of flexibility depending on the level of your multiplication facts kung fu.
These are not the Multiplication Charts you are looking for?
Click to check out the main multiplication chart page... You'll find dozens of other options including cool color multiplication charts, multiplication charts with different ranges of products and much more...
Understanding The Shaded Multiplication Chart
In the quest for effective teaching tools, educators continually seek methods that simplify complex concepts and make learning engaging. One such innovative tool is the shaded multiplication chart. This dynamic approach offers more than just a numerical reference; it provides an intuitive, different perspective on the multiplication tables. The shading feature helps to visually distinguish the clusters of higher products or the way multiples of certain numbers appear darker in specific areas of the chart. For instance, cells showing higher multiples of numbers like 7 or 8 will be darker in a 10x10 chart compared to cells with smaller products. This way, students can visually grasp how multiplication results grow as the numbers involved increase.
A shaded multiplication chart is essentially a grid where rows and columns represent numbers. Each cell in the grid shows the product of the corresponding row and column numbers. For instance, in a basic 10x10 multiplication chart, the cell at the intersection of the 3rd row and 4th column displays the product of 3 and 4, which is 12. What distinguishes this chart from the basic multiplication table is the use of shading to represent product magnitude. Instead of merely displaying numbers, these charts use different shades. The cells are shaded with varying intensities, ranging from light to dark. Lighter shades represent smaller products, while darker shades indicate larger products. For instance, the cell for the product of 2 x 3 might be a light gray, while the cell for 9 x 10 might be a darker gray or black. This comparative view aids in understanding the relative size of different products.
Even with a monochromatic scheme, a black shading chart provides a sleek, minimalist design that can be less overwhelming than colorful charts. This approach avoids the potential distraction of multiple colors to let students focus on the mathematical relationships rather than the visual elements. At the same token, the gradient shading adds a layer of interest to what might otherwise be a dry numerical table.
Reading a Shaded Multiplication Chart
Whether you're using a basic multiplication chart or a shaded one, the procedure for reading the chart remains the same. In both cases, you locate the row and column corresponding to the numbers you're multiplying, and then find their intersection to determine the product. Let’s take the version of the chart with multiplicands 1-10 and products from 1 to 100. The rows list numbers 1 through 10, and the columns do the same. Refer to the chart below…

You can interpret the shades as follows:
- Light gray = Low products (e.g., 1 to 30)
- Medium gray = Medium products (e.g., 31 to 49)
- Dark gray to black = High products (e.g., 50 and above)
Now you can correlate the shade of the gradient with the value ranges.
As mentioned above, the gradient black shading in the chart indicates the magnitude of the product. Darker shades of black represent higher products, while lighter shades represent lower products. To determine the product for any pair of numbers, locate the row and column that correspond to the numbers you are multiplying. If the intersection shade is closer to the darker end of the gradient scale, it represents a higher product. If the intersection shade is closer to the lighter end of the gradient scale, it represents a low product. For example, if you want to find the product of 3 and 4, simply find 3 on the left column and 4 on the top row. The number at their intersection is 12. Examine the shade of black where this intersection is located. Since 12 is a low product, the shade is closer to a lighter shade.
Basic Versus Shaded Multiplication Chart
A shaded multiplication chart differs from a basic multiplication chart mainly in its visual approach and the additional educational benefits it offers. Here’s how these two types of charts differ…
A basic multiplication chart shows only the multiplication results in a plain grid format. This format is typically a square or rectangular grid with rows and columns numbered from 1-9, 1-10 or up to any other number depending on the size of the chart. It contains only numbers without any additional visual aids. Each cell displays the product of the corresponding row and column numbers. For example, the cell at the intersection of the 4th row and 5th column shows 20 (4 x 5). Because of its simplicity, it serves as a reference for students to look up the product of two numbers quickly and is primarily used for rote memorization of multiplication facts. This type of chart is ideal for straightforward multiplication fact reference, practice, and basic learning of multiplication.
On the other hand, a shaded multiplication chart is similar to the basic chart, also with rows and columns numbered from 1-9, 1-10 or up to any other number depending on the size of the chart, but the key difference lies in the shading or coloring of cells. It is a variation of the traditional multiplication table where shading is used for visual emphasis, but the shading is done in grayscale. Cells are shaded with varying intensities, ranging from light to dark. The shading of cells makes multiplication more apparent, aiding in understanding and memorization beyond just the numbers. It also helps to make the learning process more interactive and engaging through visual means. This type of chart is useful for visual learners because it adds a layer of visual complexity that enhances pattern recognition and engagement and especially useful for highlighting patterns and relationships in a minimalist way.
These are not the Multiplication Charts you are looking for?
If you are looking for more variety or multiplication charts in different styles, be sure to check out the main multiplication chart page! You'll find dozens of other options including multiplication charts with larger ranges of products, multiplication chart in black and white and colored versions, cool themed multiplication charts, and much more…
Worksheet History
